How does monetary policy affect income inequality in Japan? Evidence from grouped data
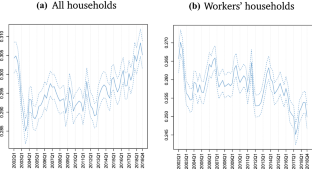
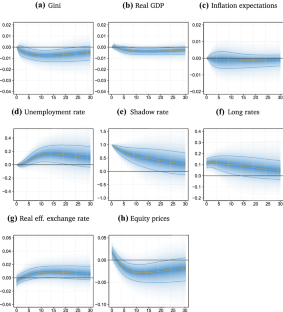
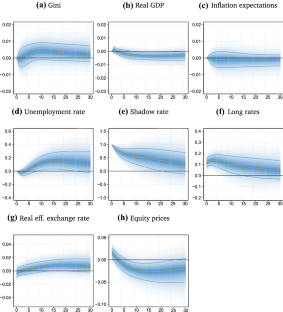
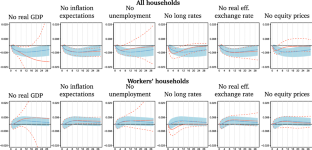
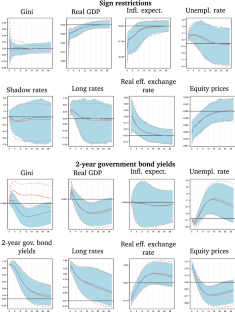
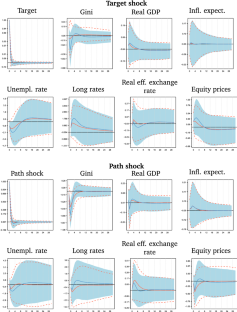
We examine the effects of monetary policy on income inequality in Japan. For that purpose, we use a novel Bayesian approach that jointly estimates the Gini coefficient from grouped income data and the dynamics of macroeconomic quantities. Our results indicate different effects on income inequality for different types of households: A monetary tightening decreases inequality when we consider a broad definition of household data that also includes the unemployed and retirees. Higher unemployment and tighter borrowing conditions make the richer (i.e., employed) comparably worse off. The result reverses, if we focus on the subsample of households whose head is employed. Through the same channels, inequality increases if monetary policy is tightened. A counterfactual analysis reveals that indeed the financial channel and the job destruction channel are the most important transmission mechanisms.
This is a preview of subscription content, log in via an institution to check access.
Access this article
Subscribe and save
Springer+ Basic
€32.70 /Month
- Get 10 units per month
- Download Article/Chapter or eBook
- 1 Unit = 1 Article or 1 Chapter
- Cancel anytime
Buy Now
Price includes VAT (France)
Instant access to the full article PDF.
Rent this article via DeepDyve
Income Inequality and Fiscal Redistribution in 31 Countries After the Crisis
Article 16 November 2018
Interrelationship Between Economic Growth and Income Inequality: The Indian Experience
Chapter © 2015

The fall in income inequality during COVID-19 in four European countries
Article Open access 08 August 2021
Notes
Alternatively one could estimate a Pareto distribution or more generally a generalized beta distribution; for the latter, however, it is not straightforward to calculate the Gini coefficient; see, for example, McDonald and Ransom (2008). More recently, Kobayashi et al. (2021) proposed a method to estimate Lorenz curves assuming more flexible distributions than the log-normal distribution. However, their method is not directly applicable to our modeling framework. That said, it should be noted that there is empirical evidence that the log-normal distribution fits Japanese income data well (Nishino and Kakamu 2011).
It should be mentioned that this model is a straightforward extension of the simple stochastic volatility model. The state variable \(h_\) means the income inequality, and this variable is used as a variable in the VAR system. Therefore, it can be seen as the joint estimation of a stochastic volatility model and VAR model. In the recent financial time series analysis, the leverage effect in the stochastic volatility model, which is a drop in the return followed by an increase in the volatility, plays an important role. However, in the context Footnote 2 Continued of income data, stylized facts do not report such a leverage effect. Thus, we assume independence between the variance and the distribution over time. Moreover, the estimation methods follow the previous standard methods in the estimation of the stochastic volatility model and VAR model.
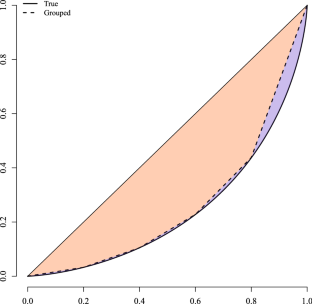
More precisely, the simulated data are constructed as follows. First, 100, 000 observations are simulated from the log-normal distribution. The observations are sorted in an ascending order and are divided into quintile groups. Then, we calculate the class income means. Using the frequencies and class income means, we can finally draw the Lorenz curve from grouped data.
The survey excludes one-person student households, inpatients in hospital, inmates of reformatory institutions, households which manage restaurants, hotels, boarding houses or dormitories, sharing their dwellings, households which serve meals to the boarders even though not managing boarding houses as an occupation, households with 4 or more living-in employees, households whose heads are absent for a long time (three months or more) and foreigner households. For more details, see http://www.stat.go.jp/english/.
The remaining 5% are accounted for by other professional services and corporative administrators.
Data mnemonics are as follows: rgdp: JPNRGDPEXP , ltir: IRLTLT01JPM156N , eq: NIKKEI225 and m3: MABMM301JPM189S .
In theory, since older households tend to depend more strongly on interest rate income—which is not covered in the income data available for this study—quantitative easing should decrease income inequality (Amaral 2017).
A similar ordering has been applied in the robustness section of Mumtaz and Theophilopoulou (2017).
For example, Nakashima et al. (2017) attribute these short-run anomalies in output and price behavior to revision of expectations of market participants regarding future economic conditions.
As an alternative, consider the approaches of Baumeister and Benati (2013) and Ludvigson et al. (2002) who manipulate the VAR coefficients and corresponding elements in the variance covariance matrix directly to offset the effects of a particular variable.
References
- Altavilla C, Brugnolini L, Gürkaynak RS, Motto R, Ragusa G (2019) Measuring euro area monetary policy. J Monet Econ 108:162–179 ArticleGoogle Scholar
- Amaral PS (2017) Monetary Policy and Inequality. Economic Commentary . https://ideas.repec.org/a/fip/fedcec/00062.html
- Bachmann R, Sims E (2012) Confidence and the transmission of government spending shocks. J Monet Econ 59:235–249 ArticleGoogle Scholar
- Baumeister C, Benati L (2013) Unconventional monetary policy and the great recession: estimating the macroeconomic effects of a spread compression at the zero lower bound. Int J Cent Bank 9:165–212 Google Scholar
- Bernanke B (2017) Some reflections on japanese monetary policy. Bank of Japan, May 24
- Bernanke BS, Kuttner KN (2005) What explains the stock market’s reaction to federal reserve policy? J Financ 60:1221–1257 ArticleGoogle Scholar
- Bohl M, Siklos PL, Werner T (2017) Do central banks react to the stock market? The case of the bundesbank. J Bank Financ 31:719–733 ArticleGoogle Scholar
- Carriero A, Clark TE, Marcellino M (2018) Measuring uncertainty and its impact on the economy. Rev Econ Stat 100:799–815 ArticleGoogle Scholar
- Chotikapanich D, Griffiths WE, Rao DSP (2007a) Estimating and combining national income distributions using limited data. J Bus Econ Stat 25:97–109. https://doi.org/10.1198/073500106000000224ArticleGoogle Scholar
- Chotikapanich D, Rao DSP, Tang KK (2007b) Estimating income inequality in China using grouped data and the generalized beta distribution. Rev Income Wealth 53:127–147. https://doi.org/10.1111/j.1475-4991.2007.00220.xArticleGoogle Scholar
- Christiano LJ, Eichenbaum M, Evans CL (1999) Monetary policy shocks: what have we learned and to what end? In: Taylor JB, Woodford M (eds) Handbook of macroeconomics, volume 1 of handbook of macroeconomics. Elsevier, London, pp 65–148 ChapterGoogle Scholar
- Coibion O, Gorodnichenko Y, Kueng L, Silvia J (2017) Innocent bystanders? Monetary policy and inequality in the U.S. J Monet Econ 88:70–89 ArticleGoogle Scholar
- Erosa A, Ventura G (2002) On inflation as a regressive consumption tax. J Monet Econ 49:761–795 ArticleGoogle Scholar
- Furceri D, Loungani P, Zdzienicka A (2017). The effects of monetary policy shocks on inequality. Journal of International Money and Finance ISSN 0261-5606. http://www.sciencedirect.com/science/article/pii/S0261560617302279
- Gertler M, Karadi P (2015) Monetary policy surprises, credit costs, and economic activity. Am Econ J Macroecon 7:44–76 ArticleGoogle Scholar
- Gornemann N, Kuester K, Nakajima M (2012) Monetary policy with heterogeneous agents. Working Papers 12-21, Federal Reserve Bank of Philadelphia. https://ideas.repec.org/p/fip/fedpwp/12-21.html
- Holloway G, Shankar B, Rahman S (2002) Bayesian spatial probit estimation: a primer and an application to hyv rice adoption. Agric Econ 27:383–402 ArticleGoogle Scholar
- Honda Y, Kuroki Y (2006) Financial and capital markets’ responses to changes in the central bank’s target interest rate: the case of Japan. Econ J 116:812–842 ArticleGoogle Scholar
- Inui M, Sudo N, Yamada T (2017) Effects of Monetary Policy Shocks on Inequality in Japan. Bank of Japan Working Paper Series 17-E-3, Bank of Japan. https://ideas.repec.org/p/boj/bojwps/wp17e03.html
- Iwasaki Y, Sudo N (2017) Myths and observations on unconventional monetary policy: takeaways from post-bubble Japan. Working paper No.17-E11, Bank of Japan
- Jarociński M, Karadi P (2020) Deconstructing monetary policy surprises’ the role of information shocks. Am Econ J Macroecon 12:1–43 ArticleGoogle Scholar
- Kobayashi G, Yamauchi Y, Kakamu K, Kawakubo Y, Sugasawa S (2021) Bayesian approach to Lorenz curve using time series grouped data. J Bus Econ Stat. https://doi.org/10.1080/07350015.2021.1883438ArticleGoogle Scholar
- Kubota H, Shintani M (2020) High-frequency Identification of Unconventional Monetary Policy Shocks in Japan. CARF F-Series CARF-F-502, Center for Advanced Research in Finance, Faculty of Economics, The University of Tokyo. https://ideas.repec.org/p/cfi/fseres/cf502.html
- Li YD, Iscan TB, Xu K (2010) The impact of monetary policy shocks on stock prices: evidence from Canada and the United States. J Int Money Financ 29:876–896 ArticleGoogle Scholar
- Lise J, Sudo N, Suzuki M, Yamada K, Yamada T (2014) Wage, income and consumption inequality in Japan, 1981–2008: from Boom to lost decades. Rev Econ Dyn 17:582–612 ArticleGoogle Scholar
- Ludvigson S, Steindel C, Lettau M (2002) Monetary policy transmission through the consumption-wealth channel. Econ Policy Rev 5:410–423 Google Scholar
- McDonald JB, Ransom M (2008) The generalized beta distribution as a model for the distribution of income: estimation of related measures of inequality. Springer, New York, pp 147–166 Google Scholar
- Miyao R (2000) The role of monetary policy in Japan: a break in the 1990s? J Jpn Int Econ 14:366–384 ArticleGoogle Scholar
- Miyao R (2002) The effects of monetary policy in Japan. J Money Credit Bank 34:367–392 ArticleGoogle Scholar
- Mumtaz H, Theophilopoulou A (2017) The impact of monetary policy on inequality in the UK. An empirical analysis. Eur Econ Rev 98:117–133 ArticleGoogle Scholar
- Nakajima J, Kasuya M, Watanabe T (2011) Bayesian analysis of time-varying parameter vector autoregressive model for the Japanese economy and monetary policy. J Jpn Int Econ 25:225–245 ArticleGoogle Scholar
- Nakashima K, Shibamoto M, Takahashi K (2017) Identifying unconvetional monetary policy shocks. Discussion Paper Series DP2017-05, Kobe University
- Nishino H, Kakamu K (2011) Grouped data estimation and testing of Gini coefficients using lognormal distributions. Sankhya Ser B 73:193–210 ArticleGoogle Scholar
- Nishino H, Kakamu K (2015) A random walk stochastic volatility model for income inequality. Jpn World Econ 36:21–28 ArticleGoogle Scholar
- Nishino H, Kakamu K, Oga T (2012) Bayesian estimation of persistent income inequality using the lognormal stochastic volatility model. J Income Distrib 21:88–101 Google Scholar
- Rigobon R, Sack B (2004) The impact of monetary policy on asset prices. J Monet Econ 51:1553–1575 ArticleGoogle Scholar
- Saiki A, Frost J (2014) Does unconventional monetary policy affect inequality? Evidence from Japan. Appl Econ 46:4445–4454 ArticleGoogle Scholar
- Shirakawa M (2010) Roles for a central bank–based on Japan’s experience of the bubble, the financial crisis, and deflation. In: Speech at the 2010 Fall Meeting of the Japan Society of Monetary Economics. Citeseer
- Spiegel MM, Tai A (2018) International transmission of Japanese monetary shocks under low and negative interest rates: a global factor-augmented vector autoregressive approach. Pacific Econ Rev 23:51–66 ArticleGoogle Scholar
- Thorbecke W (1997) On stock market returns and monetary policy. J Financ 52:635–654 ArticleGoogle Scholar
- Uhlig H (2005) What are the effects of monetary policy on output? Results from an agnostic identification procedure. J Monet Econ 52:381–419 ArticleGoogle Scholar
- Wong B (2015) Do inflation expectations propagate the inflationary impact of real oil price shocks?: evidence from the Michigan survey. J Money Credit Bank 47:1673–1689 ArticleGoogle Scholar
- Wu JC, Xia FD (2016) Measuring the macroeconomic impact of monetary policy at the zero lower bound. J Money Credit Bank 48:253–291 ArticleGoogle Scholar
Funding
Kakamu acknowledges the financial support by KAKENHI (#16KK0081, #16K03592, #25245035, #20H00080 and #20K01590).
Author information
Authors and Affiliations
- Vienna School of International Studies (DA), Favoritenstraße 15a, 1040, Vienna, Austria Martin Feldkircher
- Oesterreichische Nationalbank (OeNB), Vienna, Austria Martin Feldkircher
- Graduate School of Economics, Nagoya City University, Yamanohata 1, Mizuho-cho, Mizuho-ku, Nagoya, 467-8501, Japan Kazuhiko Kakamu
- Martin Feldkircher
